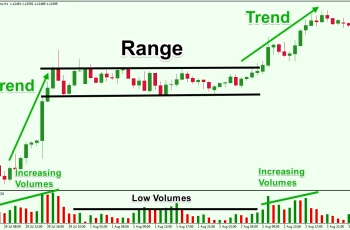
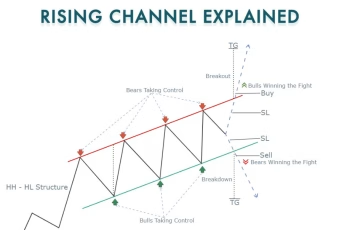
In the ever-evolving landscape of financial markets, the pullback trading strategy emerges as a beacon of opportunity for both novice and seasoned traders. Understanding how to navigate price fluctuations during trends can set the foundation for successful trading. This article delves into the intricacies of the pullback trading strategy, emphasizing its significance and providing actionable insights to enhance your trading journey.
Understanding Pullbacks in the Pullback Trading Strategy: The Essence of Market Movements
At its core, a pullback refers to a temporary price movement against the dominant trend before the market resumes its trajectory. Whether you are trading stocks, Forex, or cryptocurrencies, recognizing these movements is crucial. Markets rarely move in a straight line; they cycle through trends, reversals, and consolidations. Understanding these dynamics not only helps you identify potential entry points but also assists in managing risk.
Why Pullbacks Matter in Your Trading Strategy
Pullbacks serve as low-risk, high-reward opportunities for traders. By identifying pullbacks, traders can time their entries more effectively, capitalizing on price corrections that often precede substantial moves in the primary trend. This understanding is foundational in developing a robust trading strategy.
Market Dynamics: The Cycle of Trends in Pullback Trading Strategy
Financial markets are influenced by a myriad of factors, including economic indicators, investor sentiment, and geopolitical events. As traders, recognizing that price action is often cyclical rather than linear is essential.
The Life Cycle of a Trend in Pullback Trading
- Initial Trend: This phase represents the beginning of a new market direction.
- Pullback: A temporary dip or rise against the trend, providing potential buying or selling opportunities.
- Continuation: After the pullback, the price often resumes in the direction of the dominant trend.
This cycle illustrates that pullbacks are not merely interruptions but integral parts of the price movement continuum, crucial for the pullback trading strategy.
Fibonacci Retracements: A Trader’s Compass in Pullback Trading Strategy
One of the most valuable tools in identifying potential reversal areas during pullbacks is the Fibonacci retracement. The key Fibonacci levels—23.6%, 38.2%, 50%, and 61.8%—offer traders insights into where a pullback may stall and reverse.
How to Use Fibonacci Retracements in Your Pullback Trading Strategy
- Identify the Trend: Determine whether the market is in an uptrend or downtrend.
- Apply the Fibonacci Tool: Draw the Fibonacci retracement from the swing high to the swing low (or vice versa) based on the identified trend.
- Watch Key Levels: Monitor price action around the Fibonacci levels for signs of reversal, such as candlestick patterns or increased volume.
By incorporating Fibonacci retracements into your pullback trading strategy, you gain a systematic approach to identifying high-probability entry points during pullbacks.
The Importance of First Pullbacks in Pullback Trading Strategy
The first pullback after a trend change is often the most critical. This is the moment when early adopters can position themselves advantageously, capturing movements early in the new trend.
Advantages of Trading First Pullbacks in Your Strategy
- Early Entry: By identifying the first pullback, traders can enter the market before the majority, maximizing potential gains.
- Lower Risk: The first pullback generally occurs after a significant price movement, meaning traders can set tighter stop-loss orders.
- Confirmation of Trend: A successful first pullback often confirms the strength of the new trend, providing confidence in your trading decisions.
Recognizing Market Players: The Movers and Shakers in Pullback Trading Strategy
Understanding the different market players—big, mid, and small participants—can greatly enhance your pullback trading strategy. Each group has distinct behaviors and impacts on market movements.
The Role of Market Players in Your Trading Strategy
- Big Players: Institutional investors and hedge funds can significantly influence price trends due to their large capital.
- Mid Players: These include smaller funds and professional traders who can add volatility to the market but don’t have the same level of impact as the big players.
- Small Players: Retail traders who make decisions based on market sentiment, news, or technical analysis. They can create short-term spikes and dips but typically do not affect long-term trends.
By recognizing who is driving the market, you can tailor your pullback trading strategy to align with the prevailing market sentiment, thus improving your success rate.
Key Patterns: Insights into Market Behavior for this Strategy
Pattern recognition plays a pivotal role in successful trading. Identifying formations such as double tops, head and shoulders, and ranges can provide valuable insights into potential market reversals.
Common Patterns to Watch For in Pullback Strategy
- Double Tops: A bearish reversal pattern that occurs after an uptrend, indicating a potential change in market direction.
- Head and Shoulders: This pattern signals a reversal of an existing trend and can be a strong indicator of upcoming price movements.
- Ranges: Recognizing price ranges can help traders understand when to expect pullbacks and prepare for potential breakouts.
By incorporating pattern recognition into your pullback trading strategy, you equip yourself with the tools to anticipate market movements more effectively.
Combining Indicators for Success in Pullback Trading Strategy

The effectiveness of your pullback trading strategy increases significantly when you combine various indicators and observations. Using a multi-faceted approach allows for more informed decision-making and reduces the risk of relying solely on one metric.
Key Indicators to Combine in Your Trading Strategy
- Moving Averages: Utilize moving averages to confirm trends and identify potential pullback points.
- Relative Strength Index (RSI): The RSI can help determine whether a market is overbought or oversold, providing clues for potential pullbacks.
- Volume Analysis: Observing volume can indicate the strength of a price movement, helping to validate pullbacks or trend reversals.
By integrating multiple indicators, you enhance your ability to assess market conditions and improve the probability of successful trades within your strategy.
Final Thoughts: Building a Solid Foundation in Pullback Trading Strategy
Mastering the pullback strategy requires a deep understanding of market dynamics, price action, and the interplay of various indicators. As you embark on your trading journey, keep in mind the following principles:
- Embrace Continuous Learning: The financial markets are constantly changing. Stay informed about market trends, economic indicators, and new trading strategies.
- Practice Patience: Trading requires discipline. Wait for the right conditions to align before making your move.
- Analyze Your Trades: Regularly review your trades to learn from successes and mistakes. This reflection is crucial for growth as a trader.
By focusing on these principles and honing your pullback trading strategy, you position yourself to navigate the complexities of the financial markets successfully.
So, the pullback trading strategy is not just about recognizing price movements; it’s about understanding the underlying mechanics that drive market behavior. With the right tools, insights, and mindset, you can effectively leverage pullbacks to enhance your trading outcomes and achieve your financial goals.
Download this Ebook on Pullback Trading Strategy :
[Alwin Ng]The Secret Of Trading The First Pull Back


