Introduction to Price Action Trading
Price Action Trading (PAT) is a dynamic trading strategy focused on analyzing the raw price movement on a chart without relying on lagging indicators. Instead of cluttering your charts with various indicators, PAT emphasizes a minimalist approach that allows traders to interpret market sentiment directly from price movements. In this guide, we will explore the fundamentals of Price Action Trading, how to distinguish between clean and messy charts, identify market trends, execute effective trading strategies, and utilize chart confluence to enhance trading decisions.
1. Understanding Price Action Trading
Price Action Trading revolves around the concept that all information regarding market behavior is reflected in the price itself. As traders, we observe price movements over different time frames, which convey the collective beliefs and actions of all market participants. By focusing on these price movements, we can derive actionable insights without the noise that comes from using multiple indicators.
Why Focus on Price Action?
- Direct Reflection of Market Sentiment: Price action represents the real-time emotions of traders—fear, greed, uncertainty—all distilled into price movements.
- Elimination of Lag: Traditional indicators like MACD, RSI, and moving averages often provide delayed signals. Price action offers immediate insight into market conditions.
- Adaptability: Markets change rapidly. By focusing on price action, traders can adapt their strategies to real-time conditions rather than relying on outdated indicators.
2. Clean Charts vs. Messy Charts
The first step in mastering Price Action Trading is to recognize the importance of chart cleanliness.
Clean Charts
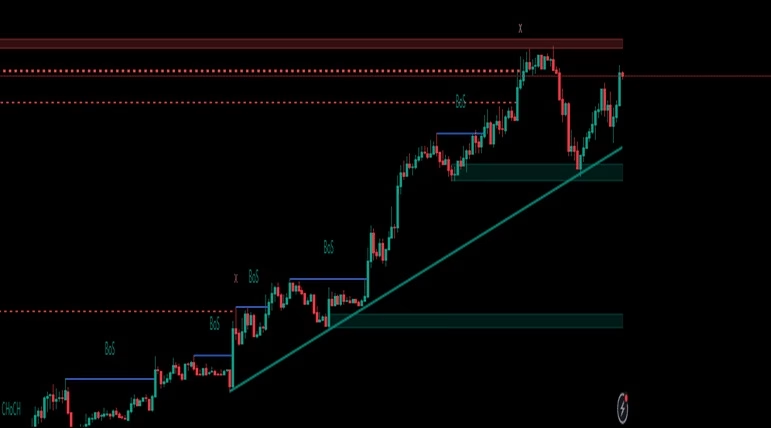
A clean price action chart consists solely of price bars, allowing traders to focus on price movement without distractions. The absence of indicators enables a clearer analysis of market trends, support, resistance, and potential entry and exit points.
Messy Charts
In contrast, messy charts are laden with various indicators, which can obscure the essential price movements. The clutter from indicators can lead to confusion and misinterpretation of market signals. The goal of PAT is to simplify analysis and maintain clarity by minimizing distractions.
Example of Clean vs. Messy Charts
- Clean Chart: Displays only price bars, highlighting price action without additional noise.
- Messy Chart: Displays indicators such as MACD, Stochastics, and Bollinger Bands, which can distract from the core price movements.
Why Clean Charts Enhance Trading
- Focus on Price Movements: Clean charts allow traders to concentrate solely on price movements, which are crucial for making informed decisions.
- Enhanced Analysis: With fewer elements to interpret, traders can quickly identify patterns and trends in the market.
- Less Overthinking: A simplified approach reduces the mental clutter, allowing for faster and more effective decision-making.
3. Identifying Trends and Consolidation with Price Action
One of the fundamental skills in Price Action Trading is recognizing whether a market is trending or consolidating.
Identifying a Trending Market
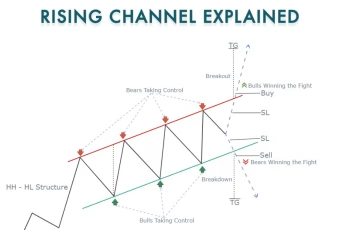
A market is considered to be in an uptrend if it is creating higher highs (HH) and higher lows (HL). Conversely, a downtrend is marked by lower highs (LH) and lower lows (LL).
Uptrend Example
In an uptrending market, each price peak is higher than the last, and each subsequent low is also higher than the previous low.
Downtrend Example
In a downtrending market, the opposite occurs; each peak is lower than the last, and each low is also lower than the previous low.
Identifying Consolidation
A consolidating market is characterized by a lack of clear direction, where price movements oscillate between defined support and resistance levels without forming higher highs or lower lows.
Consolidation Example
In a consolidation phase, price movements are typically range-bound, indicating indecision among market participants.

4. Trading with Price Action Strategies
Once you’ve mastered trend identification, the next step is to implement effective Price Action Trading strategies.
Key Price Action Strategies
- Pin Bar Reversal: A pin bar is a candlestick pattern that signifies potential reversals in market direction. It features a long wick and a small body, indicating rejection of a particular price level.Example: A pin bar forming at a significant support level can indicate a bullish reversal.
- Inside Bar: An inside bar pattern occurs when a smaller candle is completely engulfed by the previous candle, indicating potential consolidation and a brewing breakout.Example: An inside bar following a strong trend can serve as a continuation signal.
- Breakout Trading: Identify key support and resistance levels, and watch for breakouts through these levels. A breakout signifies a potential strong move in the direction of the breakout.Example: A breakout above resistance can indicate a bullish trend, while a breakout below support may suggest a bearish trend.
Developing a Trading Plan
Creating a structured trading plan based on Price Action principles is crucial for long-term success. This plan should include:
- Entry Criteria: Define clear rules for entering trades based on specific price action patterns.
- Risk Management: Determine position sizing and risk per trade to protect your capital.
- Exit Strategy: Establish take-profit and stop-loss levels based on price action analysis.
5. Using Chart Confluence and Price Action Signals
Chart confluence involves analyzing multiple factors that align to strengthen your trading decisions. By identifying areas where price action signals converge with other significant levels, traders can increase their probability of success.
Identifying Confluence Points
- Support and Resistance Levels: Recognize key support and resistance zones where price has previously reacted.
- Fibonacci Retracements: Use Fibonacci levels to identify potential reversal areas where price may react.
- Moving Averages: Although Price Action Trading minimizes indicators, moving averages can help identify dynamic support and resistance.
Example of a Confluence Setup
In the chart below, notice how a pin bar forms at a significant support level while coinciding with a Fibonacci retracement level, enhancing the validity of the setup.
Price Action Trading is a powerful approach that allows traders to focus on the most relevant data: price movement itself. By stripping down charts to their essentials, identifying trends and consolidations, implementing effective strategies, and leveraging chart confluence, traders can enhance their decision-making process.
As you embark on your journey to master Price Action Trading, remember that simplicity and discipline are key. Remove unnecessary clutter from your charts, and cultivate a keen understanding of price movements. With dedication and practice, you’ll find that trading based on Price Action can lead to more consistent and profitable outcomes.
If you’re interested in diving deeper into Price Action Trading strategies, consider exploring courses or resources that align with your trading goals. Happy trading!
How to Trade with Price Action – Kickstarter. Galen Woods
How to Trade with Price Action – Kickstarter. Galen Woods


