Rising Channel Chart Pattern
The rising channel chart pattern, also known as the ascending channel pattern, is a prominent technical analysis formation often seen in price charts across various financial markets. This pattern is an important indicator of market behavior, signifying the continuation of an ongoing upward trend. Traders and investors leverage the insights provided by this formation to make informed decisions regarding potential entry and exit points in their trading strategies.
Understanding the mechanics and implications of the rising channel pattern can enhance traders’ ability to capitalize on market movements, manage risk effectively, and improve overall trading performance.
Visual Representation of a Rising Channel Chart Pattern
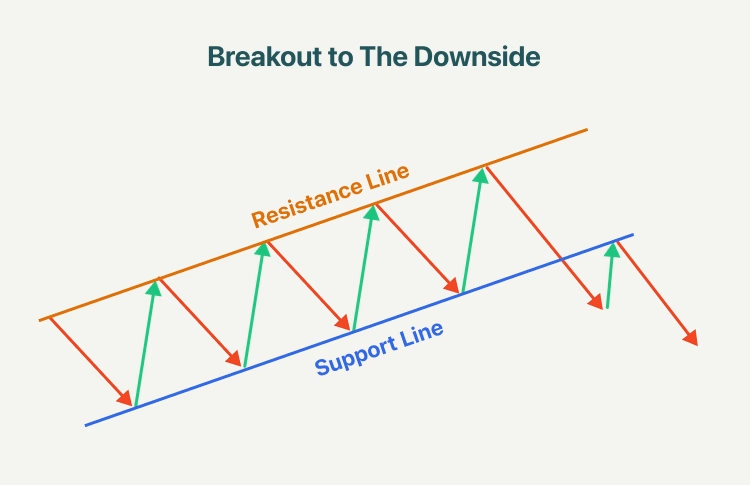
The rising channel pattern is visually distinct and is characterized by two parallel upward-sloping trendlines. These trendlines represent the prevailing uptrend and help traders identify potential buy and sell opportunities.
- Upper Trendline: The upper trendline connects the peaks of price movements, indicating resistance levels, and runs parallel to the lower trendline, typically positioned at a higher level on the chart. It is commonly referred to as the channel line, secondary trendline, or resistance line. This line provides key insights into where price may encounter selling pressure.
- Lower Trendline: In contrast, the lower trendline connects the troughs of price movements and also runs parallel to the upper trendline, located below it. It is known as the main trendline, primary trendline, or support line. The lower trendline signifies levels where buyers may step in, providing potential support during price retracements.
- Price Movements: Prices fluctuate within the rising channel, forming a series of higher highs and higher lows. This series indicates a robust uptrend, as each successive high and low demonstrates the market’s upward momentum.
- Channel Width: The distance between the upper and lower trendlines determines the channel’s width, which can vary over time. Traders pay attention to this width as it may impact price volatility and potential breakouts.
- Volume Analysis: Volume serves as a critical complement to the rising channel analysis. Generally, traders observe a decrease in volume as the price moves within the channel, suggesting a potential weakening of the trend. Monitoring volume patterns can help traders assess the strength or weakness of the uptrend.
Formation of a Rising Channel Chart Pattern

The formation of a rising channel chart pattern typically occurs during a sustained uptrend in financial markets. It develops when prices consistently create higher highs and higher lows over time, indicating persistent bullish sentiment. The key aspects of this pattern include:
- Established Uptrend: The rising channel pattern forms within an established uptrend, indicating a sequence of upward price movements. This can either be a continuation of a prior trend or the onset of a new bullish trend. Recognizing the established uptrend is critical for validating the rising channel.
- Higher Highs and Higher Lows: As prices advance, they create successive higher highs and higher lows, which are essential characteristics of the rising channel. Higher highs approach the upper trendline, while higher lows align near the lower trendline. This consistent upward movement showcases the strength of the prevailing bullish market.
- Parallel Trendlines: The pattern is delineated by connecting these higher highs and higher lows with two ascending parallel trendlines. The upper trendline joins the peaks, while the lower trendline connects the troughs. Both lines slope upwards and run nearly parallel, creating a defined channel for price movements.
- Multiple Touchpoints: For the rising channel to be considered valid, it must exhibit multiple touchpoints along both trendlines. These touchpoints indicate consistent price movement within the channel rather than random fluctuations. The more touchpoints observed, the stronger the confirmation of the rising channel.
- Decreasing Volume (Optional): While not essential, some traders monitor volume levels as prices move within the rising channel. A decrease in volume may indicate potential trend weakening, as it suggests waning buying interest. This observation should be considered alongside other analytical methods for comprehensive analysis.
Significance of a Rising Channel Chart Pattern
The rising channel chart pattern provides several key insights into price action during an upward trend in financial markets:
- Continuation of Uptrend: The primary takeaway from the rising channel pattern is that it signifies the likelihood of an ongoing uptrend. Traders interpret this pattern as an indication of persistent bullish sentiment and buying pressure, suggesting that the market is likely to continue its upward trajectory.
- Higher Highs and Higher Lows: Within the rising channel, traders observe a series of higher highs and higher lows. This consistent pattern underscores that buyers are actively driving prices higher, contributing to the overall bullish market sentiment.
- Support and Resistance Levels: The lower trendline acts as a dynamic support level, typically aligning with higher lows. Traders often view this as an opportunity to enter long positions or add to existing ones when prices approach this support. Conversely, the upper trendline serves as a resistance level where selling pressure may emerge.
- Potential Entry Points: Many traders consider buying near the lower trendline of the rising channel, anticipating a bounce within the upward pattern. This provides strategic entry points for bullish trades, allowing traders to capitalize on upward price movements.
- Caution at Upper Trendline: As prices near the upper trendline, traders exercise caution, as this line may serve as a resistance level where the uptrend could temporarily pause or reverse. Recognizing this potential resistance helps traders manage risk effectively.
- Breakout Possibility: Although the rising channel indicates a continuation of the uptrend, traders remain vigilant for potential breakouts. A breakout can occur either above the upper trendline, signaling a stronger bullish move, or below the lower trendline, indicating a possible trend reversal. Monitoring these breakout scenarios is crucial for adapting trading strategies.
- Weakening Trend (if applicable): Some traders interpret decreasing volume within the rising channel as a sign of a weakening trend. A drop in volume may suggest dwindling buying interest, which could serve as an early warning of a potential reversal. However, this interpretation should be considered alongside other analytical tools to enhance decision-making.

Trading the Rising Channel Chart Pattern
When traders spot a rising channel chart pattern, their trading decisions should be informed by the pattern’s characteristics and possible outcomes. Here are some key steps to consider for effective trading strategies:
- Confirm the Uptrend: Before taking action, traders must verify that the rising channel aligns with an established uptrend. The pattern is most reliable when it complements the prevailing market trend. This confirmation adds confidence to trading decisions.
- Identify Entry Points: Traders should look for opportunities to enter long positions near the lower trendline of the rising channel. This area is where prices typically bounce upward, providing strategic entry points for bullish trades. Identifying these entry points enhances the likelihood of successful trades.
- Set Stop-Loss Orders: Risk management is critical when trading the rising channel. Traders should employ stop-loss orders placed below the lower trendline to mitigate potential losses if the price breaks beneath the channel. This precaution helps protect capital and manage risk effectively.
- Determine Profit Targets: Traders should consider taking profits or scaling out of their position as prices approach the upper trendline. Since this line may act as resistance, setting profit targets at this level helps secure gains before potential price reversals.
- Monitor for Breakouts: Staying alert for potential breakouts from the rising channel is essential. Breakouts can occur in two scenarios:
- Upside Breakout: A price break above the upper trendline suggests a stronger bullish move. This scenario may prompt some traders to enter additional long positions to capitalize on the momentum.
- Downside Breakout: Conversely, a break below the lower trendline indicates potential trend reversal. In this case, it may be prudent to exit long positions or consider short positions, protecting against further losses.
- Use Volume Analysis (Optional): Incorporating volume analysis can provide deeper insights into trading decisions. A decrease in trading volume within the channel may indicate trend weakening, while an increase in volume during a breakout can confirm the movement’s strength.
- Apply Additional Technical Indicators: To enhance rising channel analysis, traders can utilize other technical indicators, such as moving averages, oscillators, or momentum indicators. These indicators can help validate trading decisions and confirm the pattern’s strength.
- Stay Informed: Continuously monitoring market news and developments is crucial, as unexpected events can lead to rapid price shifts. Keeping informed about economic releases, geopolitical events, and other market-moving news helps traders make timely decisions.
- Backtest and Learn: Prior to live trading, traders should consider backtesting strategies on historical data to assess their effectiveness. This practice allows traders to refine their approaches and gain confidence in their trading methods. Additionally, continuing to learn and adapt based on real trading experiences is vital for long-term success.
Frequently Asked Questions
- Is the ascending channel pattern bullish or bearish?
An ascending channel pattern is generally viewed as a bullish continuation pattern. It typically forms within an uptrend and indicates that bullish momentum is likely to persist following a consolidation phase. This characteristic makes it a favored pattern among traders seeking to capitalize on upward price movements. - How does a rising channel differ from a falling channel pattern?
A rising channel slopes upward and is associated with an uptrend, while a falling channel slopes downward and usually indicates a downward trend. Understanding this distinction is crucial for traders to identify market trends accurately. - What does a rising channel pattern reveal about market sentiment?
A rising channel reflects prevailing bullish sentiment, characterized by higher highs and higher lows. This pattern demonstrates sustained buying pressure and reinforces the idea that market participants remain optimistic about future price movements. - Can there be signs of a potential trend reversal within a rising channel?
Yes, a breakdown below the lower trendline may signal a possible trend reversal. Traders should watch for breakout signs in either direction and be prepared to adapt their strategies accordingly. - How should I manage risk when trading a rising channel pattern?
Implementing risk management strategies is crucial. Traders should set stop-loss orders below the lower trendline to protect against losses in case of a breakdown. This practice ensures that potential losses are limited, allowing traders to maintain their capital. - Can rising channel patterns be used across different financial markets?
Yes, rising channel patterns are applicable in various financial markets, including stocks, forex, commodities, and cryptocurrencies. However, traders should consider market-specific factors when applying this pattern. Understanding the unique characteristics of each market enhances traders’ ability to leverage this pattern effectively.
The rising channel chart pattern is a valuable tool for traders seeking to navigate upward trends in financial markets. By recognizing its formation, significance, and potential trading strategies, traders can position themselves to capitalize on market movements effectively. The combination of identifying entry and exit points, implementing risk management measures, and staying informed about market developments is essential for successful trading.
Incorporating the insights gained from the rising channel pattern into a broader trading strategy, alongside other technical analysis tools and indicators, can significantly enhance trading performance. Continuous learning, backtesting, and adaptation to changing market conditions are fundamental practices for traders aiming to achieve long-term success in their trading endeavors.
Whether trading stocks, forex, commodities, or cryptocurrencies, the rising channel chart pattern serves as a critical component of technical analysis, helping traders make informed decisions and navigate the complexities of the financial markets. By mastering this pattern and its implications, traders can gain a competitive edge in their trading activities.


